Soil Water Content by Karl Fischer Titration
L. Prunty, M. K. Zellis, and J.S. Bell
Department of Soil Science, North Dakota State University, Fargo, ND 58105-5638, Phone: (701) 231-8580, FAX: (701) 231-7861
Abstract
Specific analytical determination of water content is often desirable in contaminated soils. Karl Fischer (KF) titration is useful for this purpose, since it consumes only H2O, even in the presence of other volatile substances. Although widely used for water content determination in industrial and food products, KF has been virtually ignored in soil and environmental science. Oven drying (OD), conversely, is considered the standard method of soil water determination, but is an indiscriminate determiner of all volatiles.
We examined KF titration for soil water content determination. Two soil types (sand and loam) were mixed with varying amounts of water (0 to 240 g kg-1) and octane or toluene (0 to 128 g kg-1). The prepared samples containing water only, water and octane, and water and toluene were analyzed for volatile/moisture content using OD/KF analysis. Soil moisture values determined by our calibrated KF method (wc) compared favorably to those determined by OD (wo) in terms of regression slope, intercept, correlation coefficient, and Student’s t. Regression slopes ranged from 0.980 to 1.009 while intercepts ranged from -0.6 to 7.8 g kg-1. Plots of the data show essentially a 1:1 correspondence of wc to wo.
Keywords: octane, toluene, moisture, oven drying, VOC, analytical method
Introduction
Karl Fischer (KF) titration may be used to determine water content of a remarkable variety of materials by employing a reaction that specifically consumes water. Using KF for soil water content determination in contaminated soils research could potentially improve the scope and quality of the research.
The KF reaction consumes water when alkyl sulfite is oxidized to alkyl sulfate by iodine. Methanol is the preferred medium for the sample, which must also have a controlled pH. In the coulometric titration apparatus that we used, I2 is generated by the anodic oxidation of iodide.
Successful water content measurements by KF have been reported in scientific journals for fertilizers, seeds, dairy products, molasses, sugar, fats, oils, wool, and wood (Johnson and Smith, 1964; Benjamine and Grabe, 1988; Mickle, 1957; Strange, 1972; Epps, 1966; Novekova et al., 1994; Ille, 1965; Wilson and Sandomire, 1960; Huy, 1985). Scholz (1984) has compiled specific information on application of KF to nearly 60 substances and substance groups. However, soil analysis by KF is virtually unknown. This is unfortunate since KF offers distinct analytical advantages as well as low cost.
An analytical gap that could have been filled by KF seems clearly evident to us in a recently published study. We are not specifically critical of this particular study, but we do feel it represents many studies in the contaminated soils arena that could benefit from adding KF analysis for water content. The study (Smith, et al., 1994) reported rates of volatilization of gasoline components from soil at various moisture contents. Soil samples were prepared at various water and gasoline contents. Gas chromatography (GC) was used to analyze soil samples for content of the gasoline fractions at several times and the volatilization rates were calculated. It was found that water content had a major influence on the gasoline component volatilization rate. The missing link that could have been provided by KF is the water content of the soil as the experiment proceeded. As published, the study provides only the initial water content and makes an implicit assumption that the water content did not change appreciably during volatilization of the gasoline. Water content data provided by KF could have been used to test this assumption. Oven drying (OD) the samples and comparing with total volatiles (water by KF and gasoline components by GC) could also have provided an additional mass balance check on the primary (gasoline volatilization) data.
Contaminated soils by definition often contain volatile substances in addition to water. Accurate analysis results for water content of such soils cannot then be performed by the conventional OD method. For these situations, KF soil water content determination may be advantageous. Our objective was to validate KF titration as a means of obtaining soil water content information. The validation was to be conducted for two soils both in the presence and absence of volatile organic compounds.
Laboratory Procedures
Soil and volatile liquids were combined in six categories designated by a three-letter code. The first letter indicates the soil used, quartz sand (S) or Barnes loam (L; fine-loamy, mixed Udic Haploboroll). Soil was mixed with volatile liquids as designated by the final two letters of the code: 1. water (WW), 2. water and octane (WO), and 3. water and toluene (WT). Thus, LWW designates the loam soil containing water only, and so forth. The soils have different particle size distributions, organic matter content, and CEC (Table 1). Octane and toluene are frequently present at contaminated soil sites (Arthurs, et al., 1995). They possess somewhat different physical properties (Table 2).
We mixed samples using about 25 g dry soil and varying amounts of water, octane, and toluene. Mass (± 0.01 g) of each constituent of the mixture was determined by weighing before and after introducing it. Water, octane, and toluene concentrations in the mixed samples ranged from 0 to 240, 0 to 128, and 0 to 128 g kg-1, respectively. Sand samples were mixed with less octane and toluene because the sand had less porosity than the loam. Stirring and aging for at least an hour produced homogeneous samples.
Samples were prepared in batches of seven. Water contents in each batch spanned a range from air-dry to near saturation. Usually each sample batch was subsampled on two days. Subsamples were split for OD ('first' subsamples) and KF ('second' subsamples) analysis. Three calibration samples, 5 g of soil with 100, 500, or 900 ml water and no octane or toluene, were prepared for each subsample set.
We determined volatiles content on the first subsample by oven drying initially at 56 °C for at least 16 hours and then at 105 °C for 1 to 2 hours. After KF analysis, the second subsamples were oven dried in the same manner. Gravimetric volatiles content for these subsamples was determined by weight loss on drying and/or gravimetric additions. Extracting with 20 ml methanol was the first step in KF analysis. After shaking and centrifuging for 15 min at 544 X g, a portion of the supernatant was saved for KF analysis. Drying the methanol-extracted samples initially at 56° avoided boiling of the methanol (bp = 64.5 °C) extractant.
Water in approximately 100 ml of the supernatant was quantified by KF titration. We injected by syringe into an Accumet coulometric KF titration module attached to an Accumet Model 150 titration controller. The mass of the injected sample was determined to the nearest 0.0001 g.
For quality control we rinsed the syringe between samples. Before drawing the sample for the next titration, the syringe was rinsed twice with methanol and once with the sample itself. We also titrated two reference standards and one blank with each run.
Quality KF analysis relies on multiple factors including reagent life, calibration protocol, and extraction efficiency. The titration cell was maintained continuously in a ready-to-titrate condition. We found calibration samples to be indispensable even though coulometric titration is considered an absolute quantitative method. Our extraction protocol was standardized after trials using: 1. less methanol or 2. double extraction. We ultimately used a single 20 ml extraction for our 5 g samples. Following the manufacturer's instructions and using good laboratory practice were very helpful.
Calculations
The standard OD method allows calculation of the volatile fraction of a sample. For samples to which only water has been added, the volatile fraction was taken as equal to the moisture content.
For our subsamples containing both water and octane or toluene, the gravimetric water content by OD (wo) was calculated by
wo = (V - C)/D, (1)
where V is the mass of volatiles; C is the mass of the nonwater volatile compound, octane or toluene; and D is the dry soil mass. Calculation of C assumed the ratio C:D was unchanged since the sample was mixed.
Calculations for KF water determination are more complex. Mass fraction of extract water (Xw) equals the water mass titrated (digital readout of the titrator) divided by the mass injected into the titrator. When samples contained water only, we must also have
Xw = W/(M + W), (2)
where W is the total water extracted from the sample and M is the total methanol extractant. Equation (2) may be solved for W in terms of M and Xw. Soil water content (w) is consequently
w = W/D = (XwM/D)/(1 - Xw). (3)
When both water and another volatile compound (C) are present in the extract, Xw is given by
Xw = W/(M + W + C). (4)
The extract volatile compound mass fraction (Xc) is
Xc = C/(M + W + C). (5)
Equations (4) and (5) yield the expression for water content by KF
wk = W/D = (XwM/D)/(1 - Xw - Xc). (6)
We calculated linear regression coefficients following the approach of Miller and Miller (1988) in which an instrument signal is expressed in terms of known concentrations. We considered w determined gravimetrically (wg) equivalent to the known concentration and w determined by KF (wk) equivalent to the instrument signal. Then, the calibration sample data was least-squares fit to
wki = mwgi + b + ei. (7)
The calibrated water content for a sample in the same batch as the calibration samples is therefore calculated by
wc = (wk - b)/m. (8)
Results
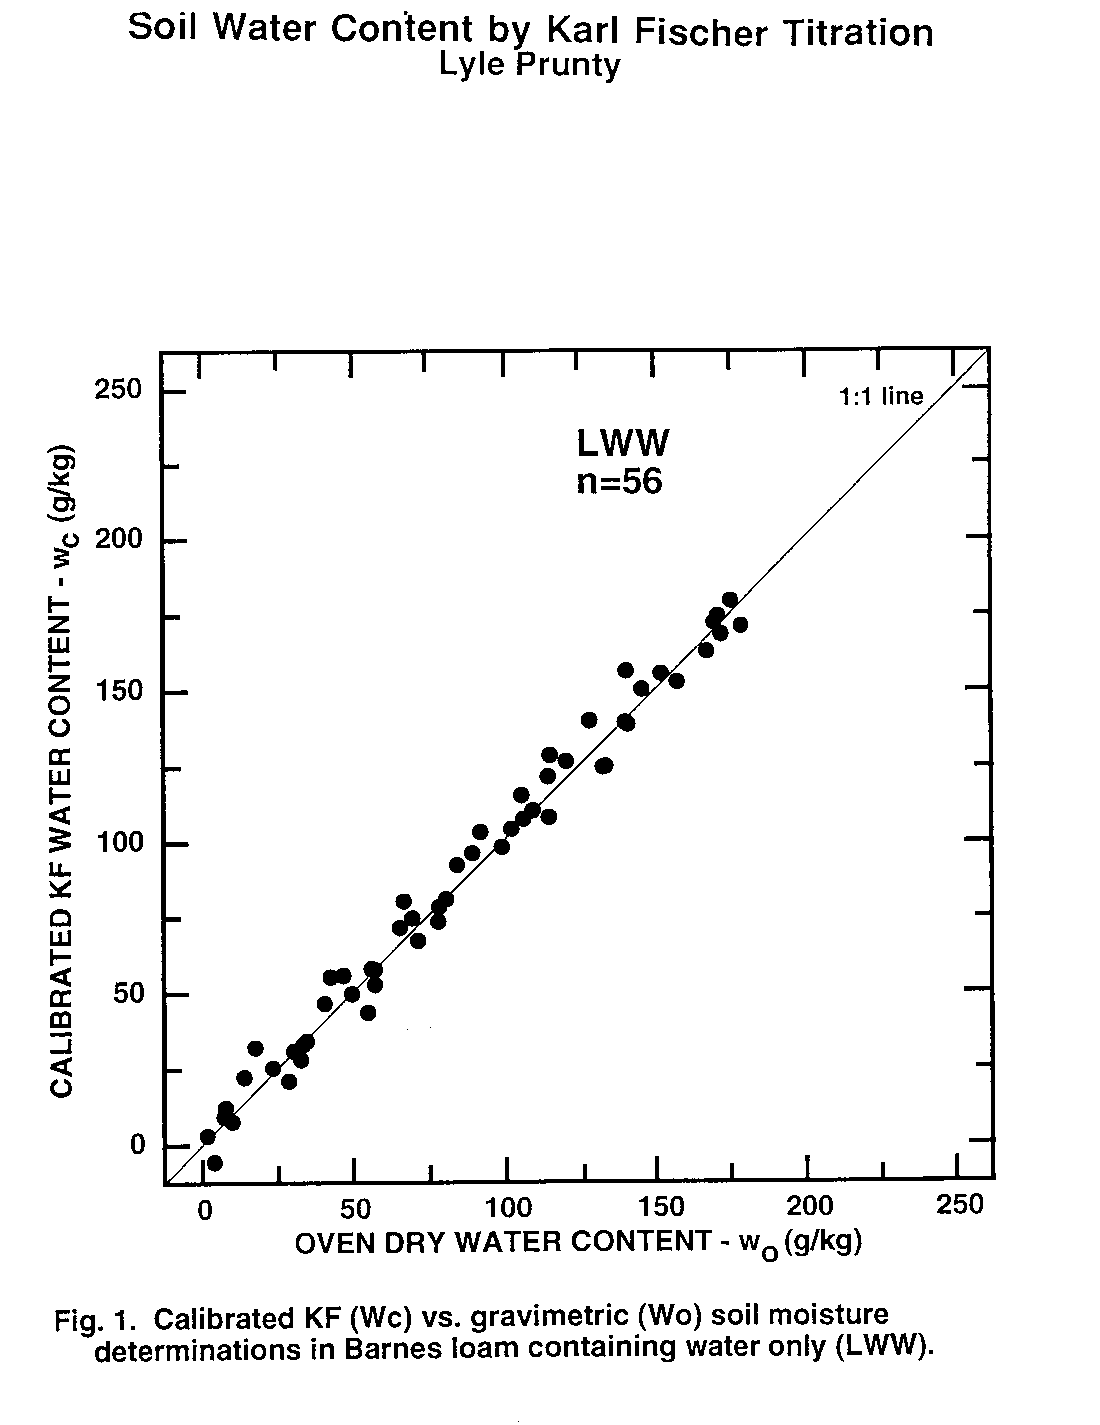
Water content of second subsamples determined by oven drying (wo, Eq. (1)) was taken as the standard method to which KF-determined water content (wc) was compared. Thus, data pairs (wo, wc) obtained from second subsamples were examined statistically (Table 3) and graphically (Fig. 1 to 6). There was no evidence of interference of octane or toluene with the KF procedure. However, certain members of the experimental matrix did exhibit distinctly larger variability than others. As detailed below, the statistics and the graphs both provided evidence verifying the KF method.
Statistical
Regression slope, intercept, coefficient of determination (r2), and Student's t (Table 3) were calculated for each sample type. Most had regression slopes (m) with confidence intervals (a = 0.05) that included m = 1, the expected value for methods that are equivalent (Miller and Miller, 1988). The only exception was SWW, where the slope confidence interval upper limit was 0.99. Four regression intercepts (b) had confidence intervals (a = 0.05) that included b = 0. Again, for methods that are equivalent, b = 0 is expected (Miller and Miller, 1988). The SWO and SWT groups had intercepts with confidence intervals that did not include zero. The lower limits of the intercepts of these two matrix elements were 3.5 and 2.4 g kg-1, respectively. Correlation coefficients were all positive and greater than 0.98. Student's t tests of each correlation coefficient found a significant correlation between wo and wc for all sample types Thus, there is a positive, highly-significant, linear relationship between results obtained by the OD (wo) and KF (wc) methods.
Graphical
Plots of (wo, wc) exhibit the high correlation between KF and OD methods (Fig. 1 to 6). All the graphs show points spanning the range of water contents falling near the 1:1 line. Failure of KF analysis due to soil type, presence of volatile compounds, or water:volatile compound ratio is not evident from the graphs. Actually, KF analysis provided the most consistent data we collected.
The graphs exhibit some differences in intercept and scatter. Figures 4 and 6 show intercepts greater than zero, as also indicated by the statistics of Table 3. Possible reasons for this are discussed in the next paragraph. Scatter of the points was not consistently greater in any one area within the plots, indicating that variance was independent of moisture content. Scatter was lowest for SWW (Fig. 2) and LWO (Fig. 3), and highest for LWT (Fig. 5) and SWT (Fig. 6). Non-uniform volatilization losses of octane or toluene from subsamples could result in increased scatter, as could non-uniform distribution of octane or toluene between subsamples.
Two experimental errors may have contributed to the high intercepts in the SWO and SWT data sets. The first occurs in the calculation of wo by Eq. (1). The calculation requires a value for C, the amount of non-water material volatilized by oven drying. In Eq. (1) we used C values based on the amount of octane or toluene added to the soil. Volatilization of the octane or toluene during subsampling would make this C too large. Determination of C after subsampling by a low-error measurement method, perhaps gas chromatography (GC), could possibly resolve this question. Greater volatilization appears to have taken place from the sand than from the loam, since SWO and SWT have intercepts significantly greater than zero, while LWO and LWT intercept confidence intervals include zero. Greater volatilization from the sand agrees with conclusions reached by Arthurs, et al. (1995) based on volatilization rates of gasoline components from different soil textures. The second hypothetical error occurs because a small amount of water (about 1-3 g kg-1) is present initially in the octane or toluene. It will be extracted and titrated but is not accounted for in the calibration samples or by Eq. (8). This may make actual KF titration results slightly higher than would be calculated based on the amount of water initially added to the sample. However, even if the water concentration in the octane or toluene is at the upper end of the range at 3 g kg-1, there would only be a maximum water concentration change in the soil of 0.4 g kg-1 due to octane or toluene addition. This is small compared to the intercept confidence intervals of Table 3.
Discussion
The preceding sections deal with verification of KF as a method for soil water content determination. Samples consisted of mixtures of gravimetrically-measured components: dry soil, water, and octane or toluene. The procedures and equations above are thus not in ideal form for considering analysis of unknown samples. In the remainder of this section we propose procedures and calculations for unknown samples.
Calibration is the first step. The samples could be grouped with other samples having common soil type. Each soil type should be subsampled and the subsamples oven dried to obtain material for calibration samples. A least-squares fitting of Eq. (7) may then be used to obtain values for m and b. Calibrated values from the KF procedure are found by using Eq. (8). However, Eq. (6) can be expressed in a manner that more directly reflects the KF laboratory procedure, as follows.
The mass fraction of water in the methanol extract as a whole is expressed by Eq. (4). The mass fraction of water in the portion of the extract injected into the KF instrument must be the same and may be expressed as
Xw = Tw /MI, (9)
where Tw is the water mass titrated by the KF instrument and MI is the mass of the extract injected into the instrument.
Total water in the unknown sample is obtained from Eq. (4) rewritten here as
W = Xw (M + (W + C)), (10)
where W and C are grouped because they represent the total volatile content of the sample and may be determined by oven drying.
Uncalibrated values of water content, wk, may now be calculated from the left-hand equality in Eq. (6). Then Eq. (8) yields the calibrated KF result for unknown samples.
Conclusions
Reliable soil water content data was produced using KF. This was true for two soil types with and without octane or toluene. Addition of octane or toluene did not interfere with KF titration, although variability sometimes increased. Independent measurement of volatile compounds other than water, perhaps by GC, would be desirable from a quality control standpoint, and might reduce variability.
Calibration samples should be used with each batch of samples analyzed by KF. Duplicate calibration samples should be used, one set with low water (only), one set with high water (only), and one set with medium water and a moderate level of the nonwater volatile compounds of interest.
Overall, the results of this study illustrate that analysis of soil for volatiles other than water is entirely feasible using KF titration. This may be important where there is a suspicion of soil contamination by unknown volatile substances. If KF titration results (wc) are less than V/D from Eq. (1), it is implied that the unknown value of C (Eq. (1)) is greater than zero. For work of this type, KF is good because it requires no knowledge of the non-water substance. Also, equipping a laboratory for KF titration is considerably less expensive than to equip for GC, the most likely analytical alternative.
Acknowledgment
The work upon which this report is based was supported by federal funds provided by the USDA/CSREES, grant number 95-37107-1961.
References
Arthurs, P., W. H. Stiver and R. G. Zytner, 1995. Passive volatilization of gasoline from soil, Journal of Soil Contamination, 42, pp. 123-135.
Benjamin, E. and D.F. Grabe, 1988. Development of oven and Karl Fischer techniques for moisture testing of grass seeds, J. Seed Technol., 12, pp. 76-89.
Epps, E.A., 1966. Determination of water in molasses by the Karl Fischer method, J. Assoc. Off. Anal. Chem., 49, pp. 551-554.
Huy, V.R., 1985. Measurement of moisture content in resinous wood, In: Symposium on forest products research international- achievements and the future, Pretoria, National Timber Research Institute of the South African Council for Scientific and Industrial Research, pp. 16.20.1-16.20.10.
Ille, A.M., 1965. Some applications of Karl Fischer's method for determining the water content in the vegetable oil industry, Indus. Aliment., 16, pp. 303-309.
Johnston, I. and E.J. Smith, 1964. The determination of water in granular fertilizers by a modified Karl Fischer method, Chem. and Indus., 8, p. 315.
Mickle, J.B., 1957. Comparison of the Mojonnier, Cenco moisture balance and Karl Fischer titration as methods of determining the total solids in fluid milk, Okla. Agr. Expt. Sta., Bull. T-67.
Miller, J.C. and J.M. Miller, 1988. Statistics for analytical chemistry. Ellis Horwood Limited, West Sussex, England, 2nd ed.
Novekova, M., J. Copikova and S. Liskova, 1994. Review of methods for determining the moisture content of crystalline sugar, Listy-Cukrovarnicke-a-Reparske, 110, pp. 6, 169-173.
Scholz, E., 1984. Karl Fischer titration, Springer-Verlag, Berlin, Germany.
Smith, M., W.H. Stiver, and R.G. Zytner, 1994. The effect of varying water content on passive volatilization of gasoline from soil, In: 49th Annual Purdue Industrial Waste Conference Proceedings, Lewis Publishers, Chelsea, MI, pp. 111-115
Strange, T.E., 1972. Collaborative study of moisture in cheese by gas chromatography and by Karl Fischer titrimetry, J. Assoc. Off. Anal. Chem., 55, pp. 507-510.
Wilson, J.R. and M.M. Sandomire, 1960. The determination of moisture in wool with Karl Fischer reagent, Textile Res. J., 30, pp. 587-591.
Table 1. Properties of the soils.
|
Soil |
Clay |
Silt |
Sand |
OM |
CEC |
|
(---------------%---------------) |
(g kg-1) |
(cmol kg-1) |
|||
|
Barnes loam |
26 |
42 |
32 |
40 |
24 |
|
quartz sand |
0 |
0 |
100 |
0 |
0 |
Table 2. Physical properties of octane and toluene.
|
Compound |
Chemical formula |
Molecular weight |
Specific gravity |
Vapor pressure |
Solubility in water |
|
(g mol-1) |
(Mg m-3) |
(kPa) |
(g kg-1) |
||
|
Octane |
C8H16 |
114.23 |
0.704 |
1.33 |
0.0 |
|
Toluene |
C6H5CH3 |
92.10 |
0.860 |
2.93 |
0.5 |
Table 3. Statistics of wc on wo regression: slope (m) and intercept (b) with 95% confidence intervals. Most sample types have confidence intervals which include m = 1 and b = 0, indicating equivalence of the KF and OD techniques.
|
Sample type |
Slope |
Intercept |
r2 |
t valuea |
|
(g kg-1) |
||||
|
LWW |
1.00 ± 0.03 |
1.7 ± 3.3 |
0.985 |
60 |
|
LWO |
1.01 ± 0.03 |
-0.6 ± 3.3 |
0.989 |
62 |
|
LWT |
1.01 ± 0.05 |
3.1 ± 5.2 |
0.973 |
38 |
|
SWW |
0.98 ± 0.01 |
-0.3 ± 1.4 |
0.998 |
141 |
|
SWO |
0.99 ± 0.03 |
6.1 ± 2.6 |
0.990 |
68 |
|
SWT |
1.00 ± 0.06 |
7.8 ± 5.4 |
0.964 |
33 |
a Calculated by t =

Figure 1. Calibrated KF (Wc) vs. Gravimetric (Wo) soil moisture determinations in Barnes loam containing water only (LWW).
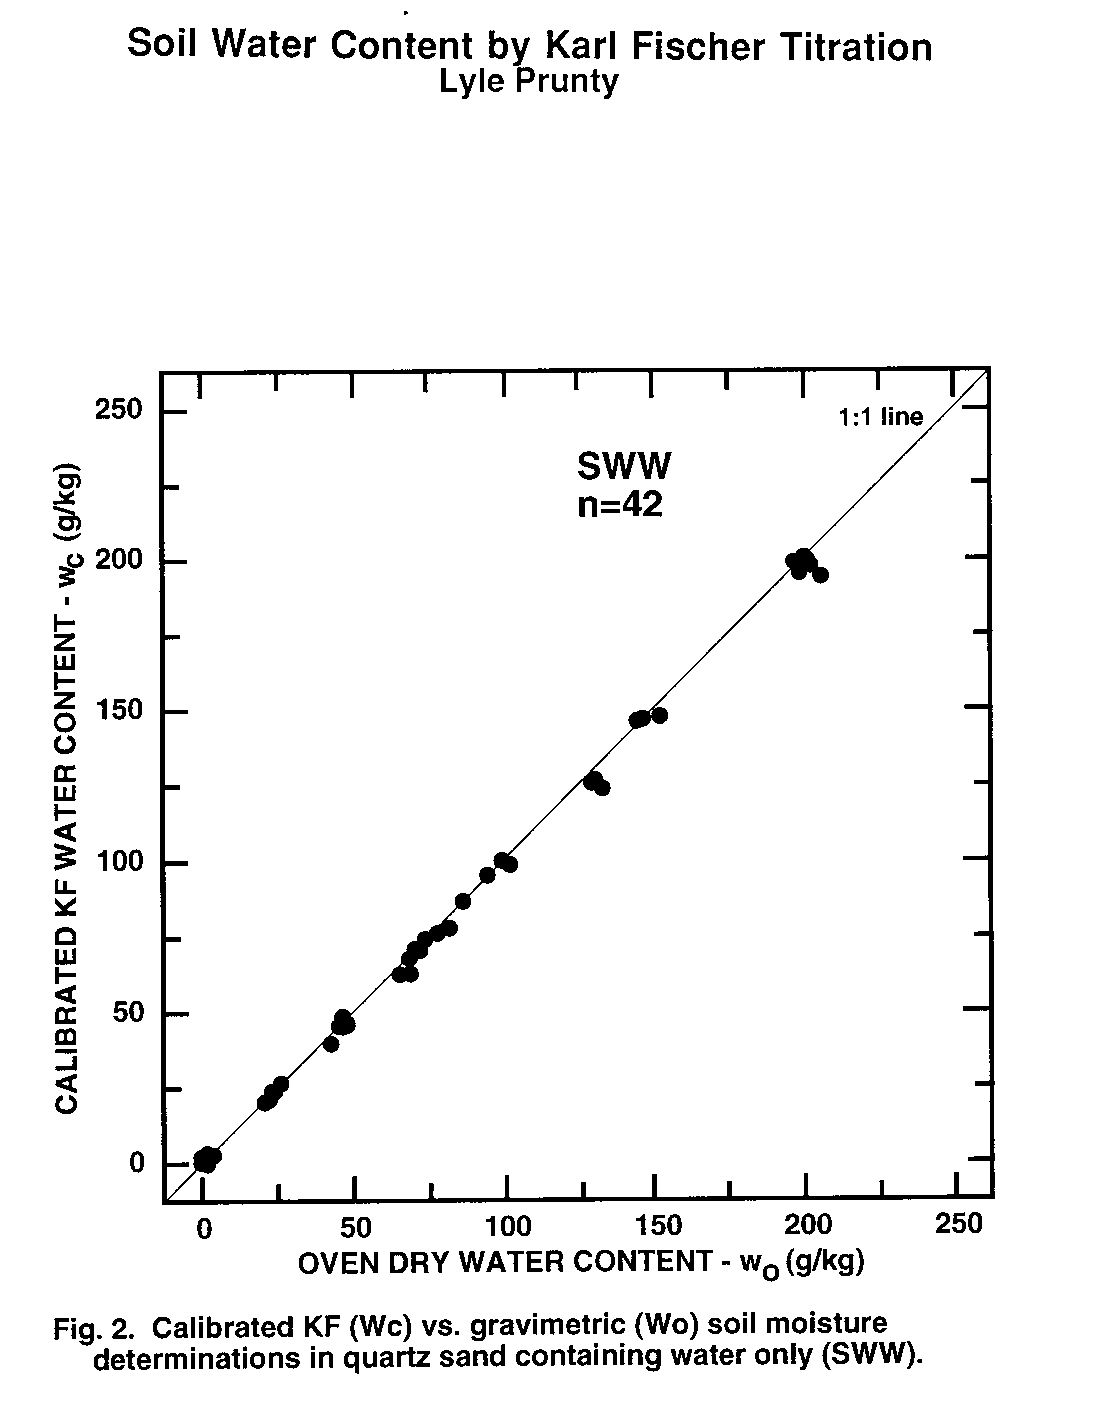
Figure 2. Calibrated KF (Wc) vs. Gravimetric (Wo) soil moisture determinations in quartz sand containing water only (SWW).
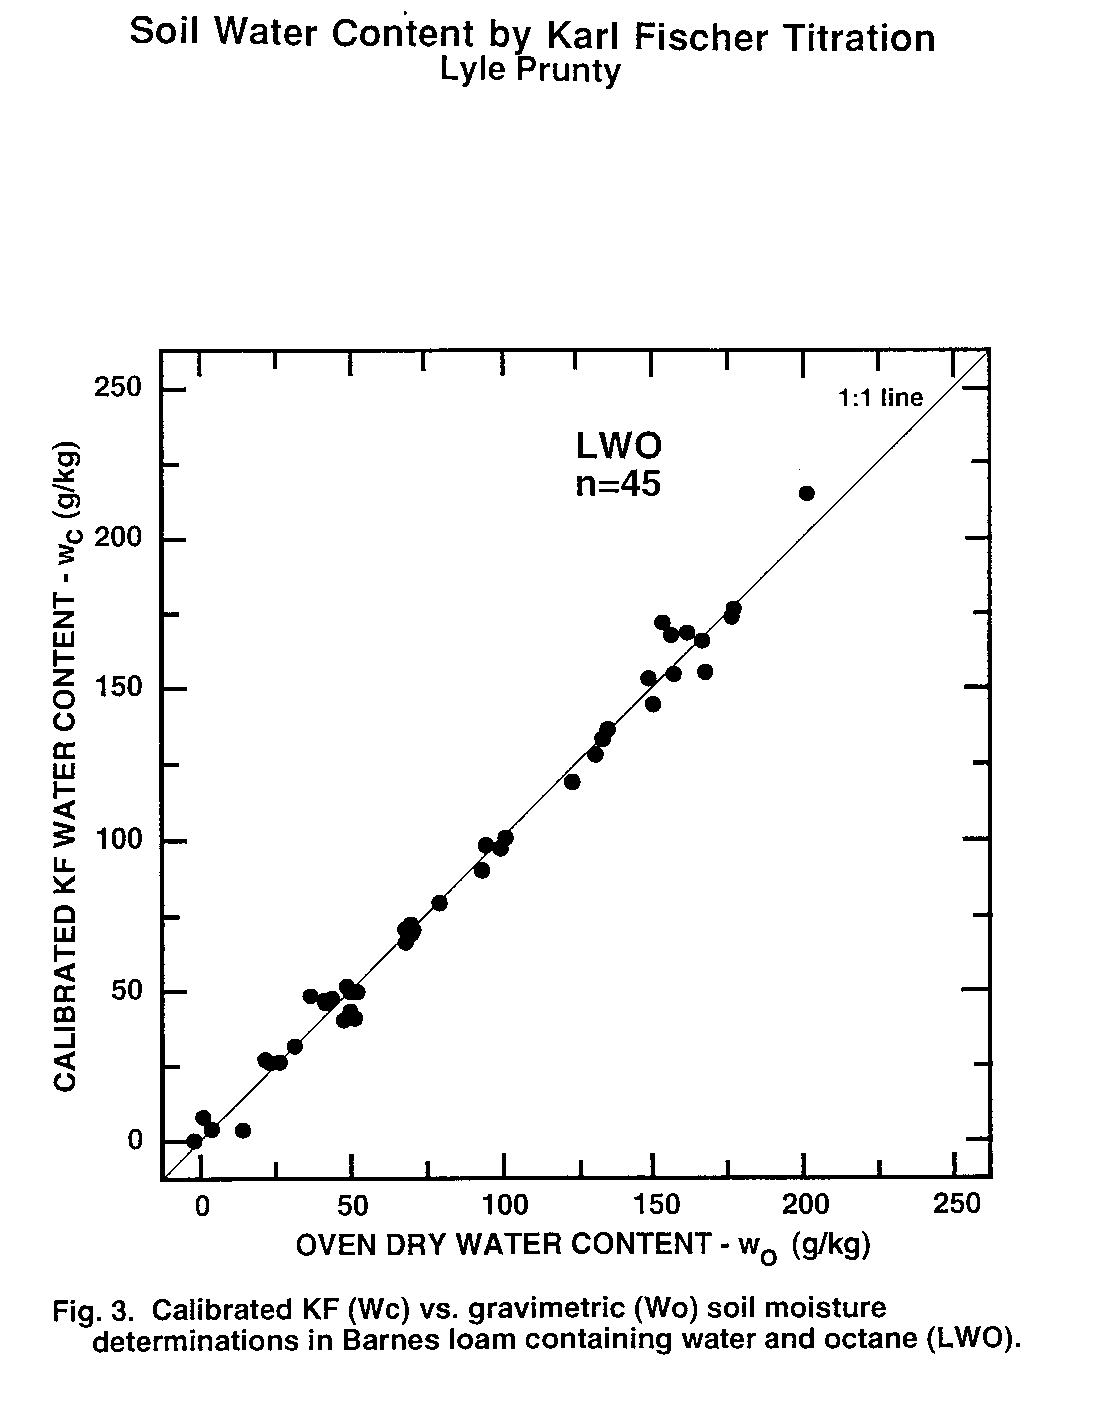
Figure 3. Calibrated KF (Wc) vs. Gravimetric (Wo) soil moisture determinations in Barnes loam containing water and octane (LWO).
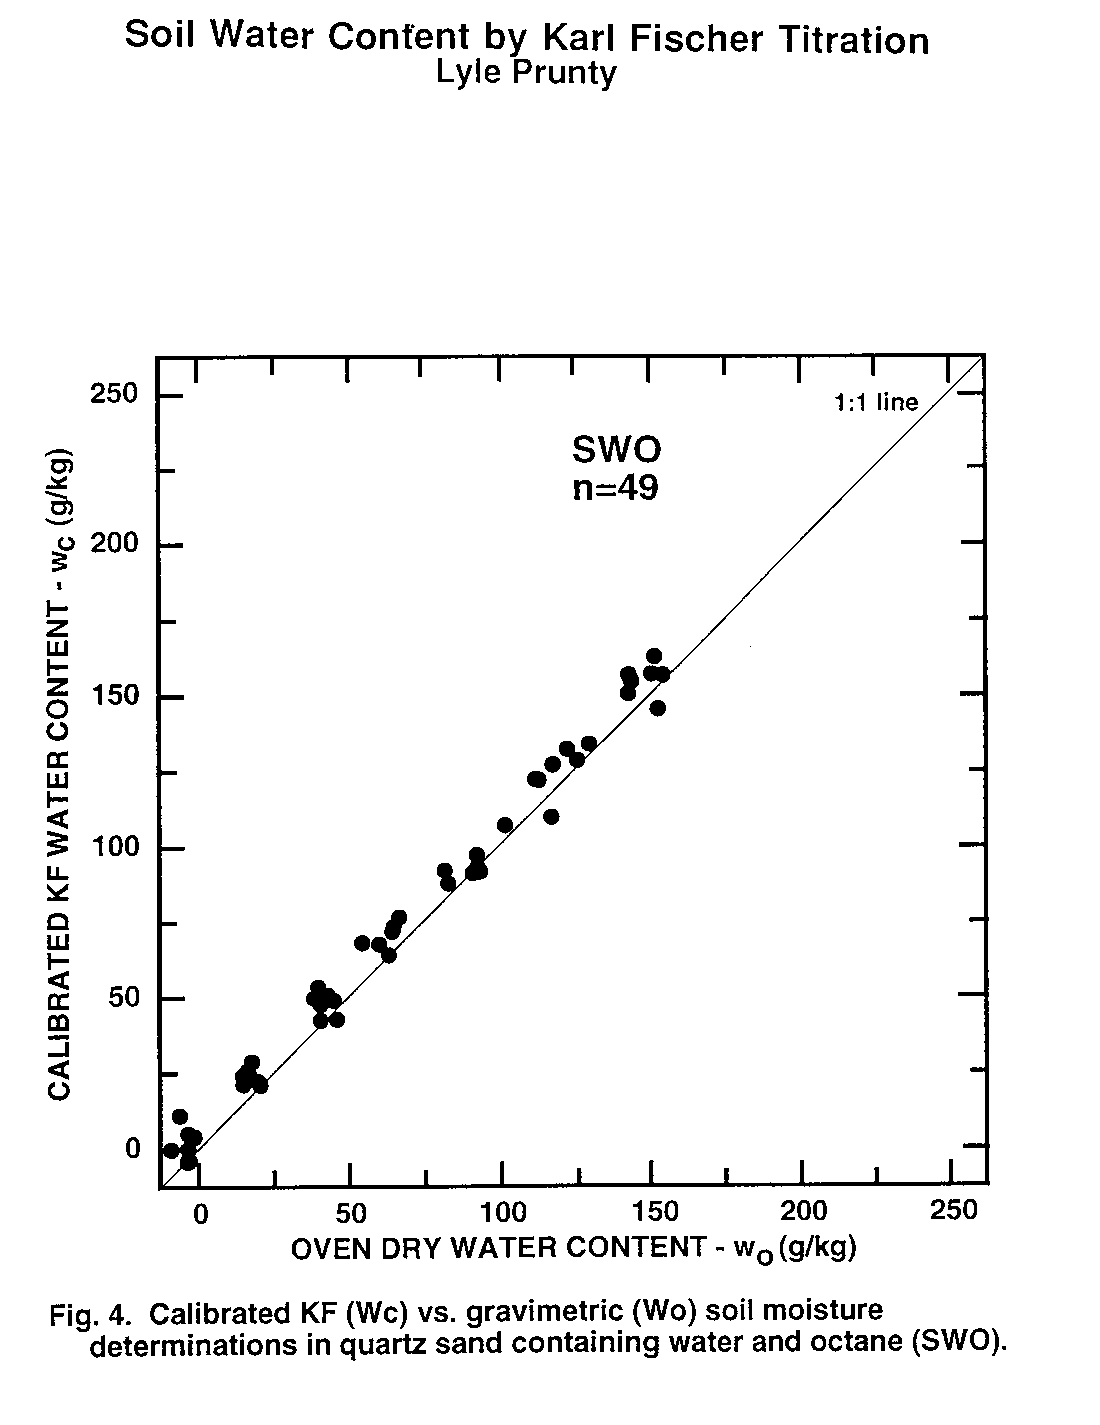
Figure 4. Calibrated KF (Wc) vs. Gravimetric (Wo) soil moisture determinations in quartz sand containing water and octain (SWO).
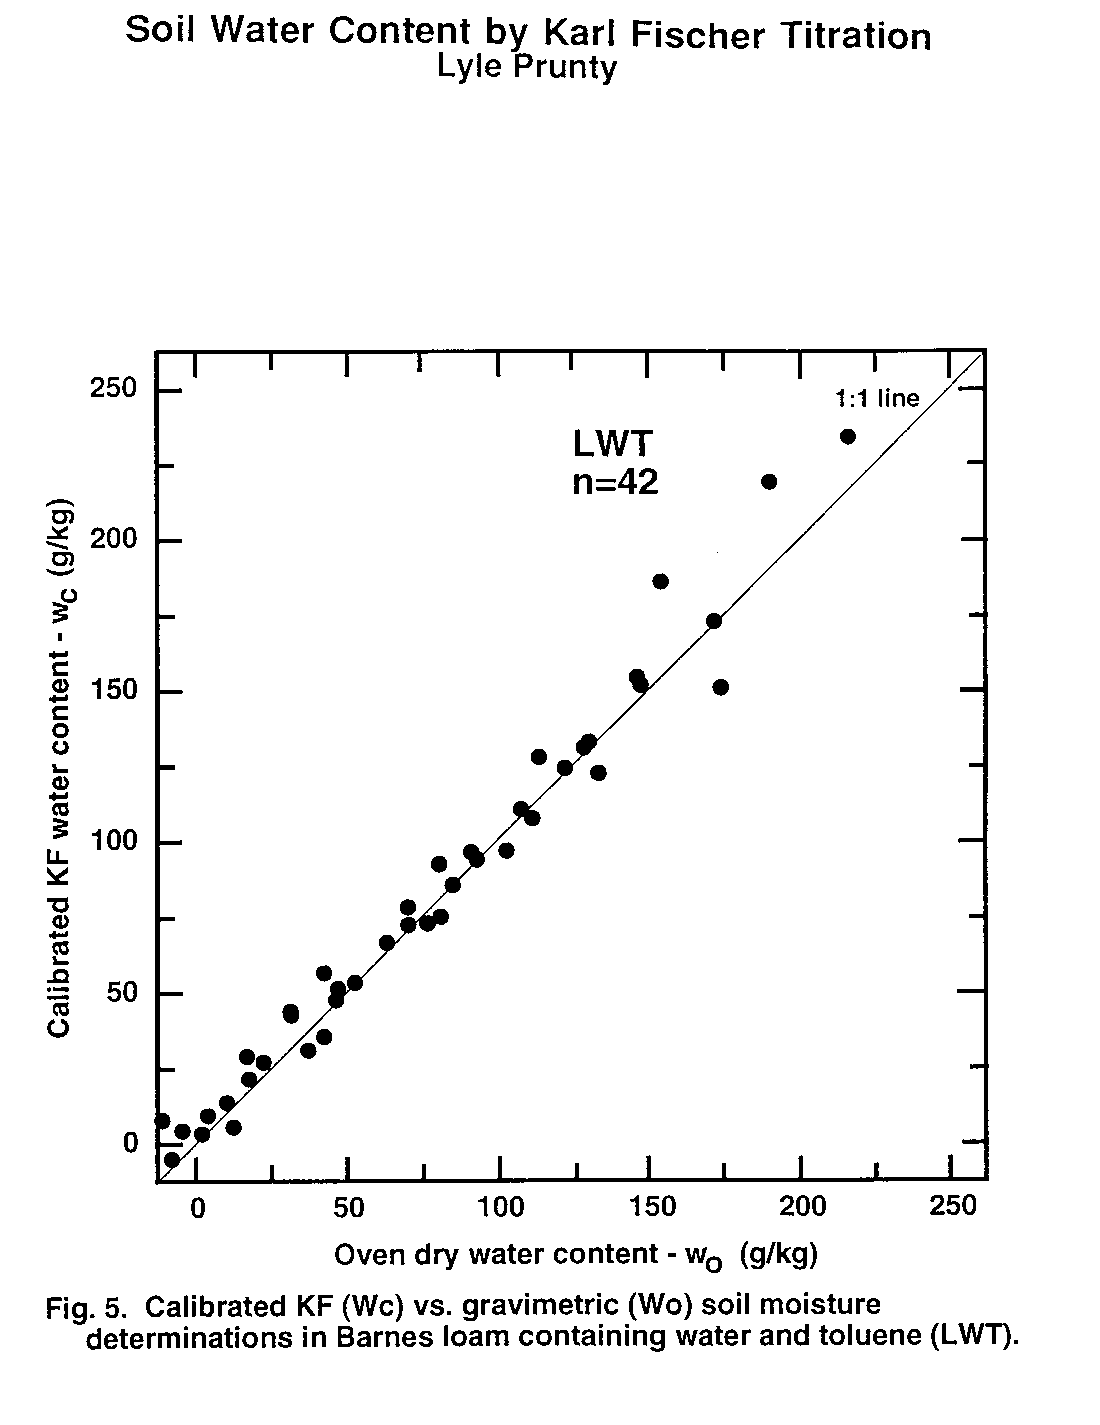
Figure 5. Calibrated KF (Wc) vs. Gravimetric (Wo) soil moisture determinations in Barnes loam containing water and toluene (LWT).
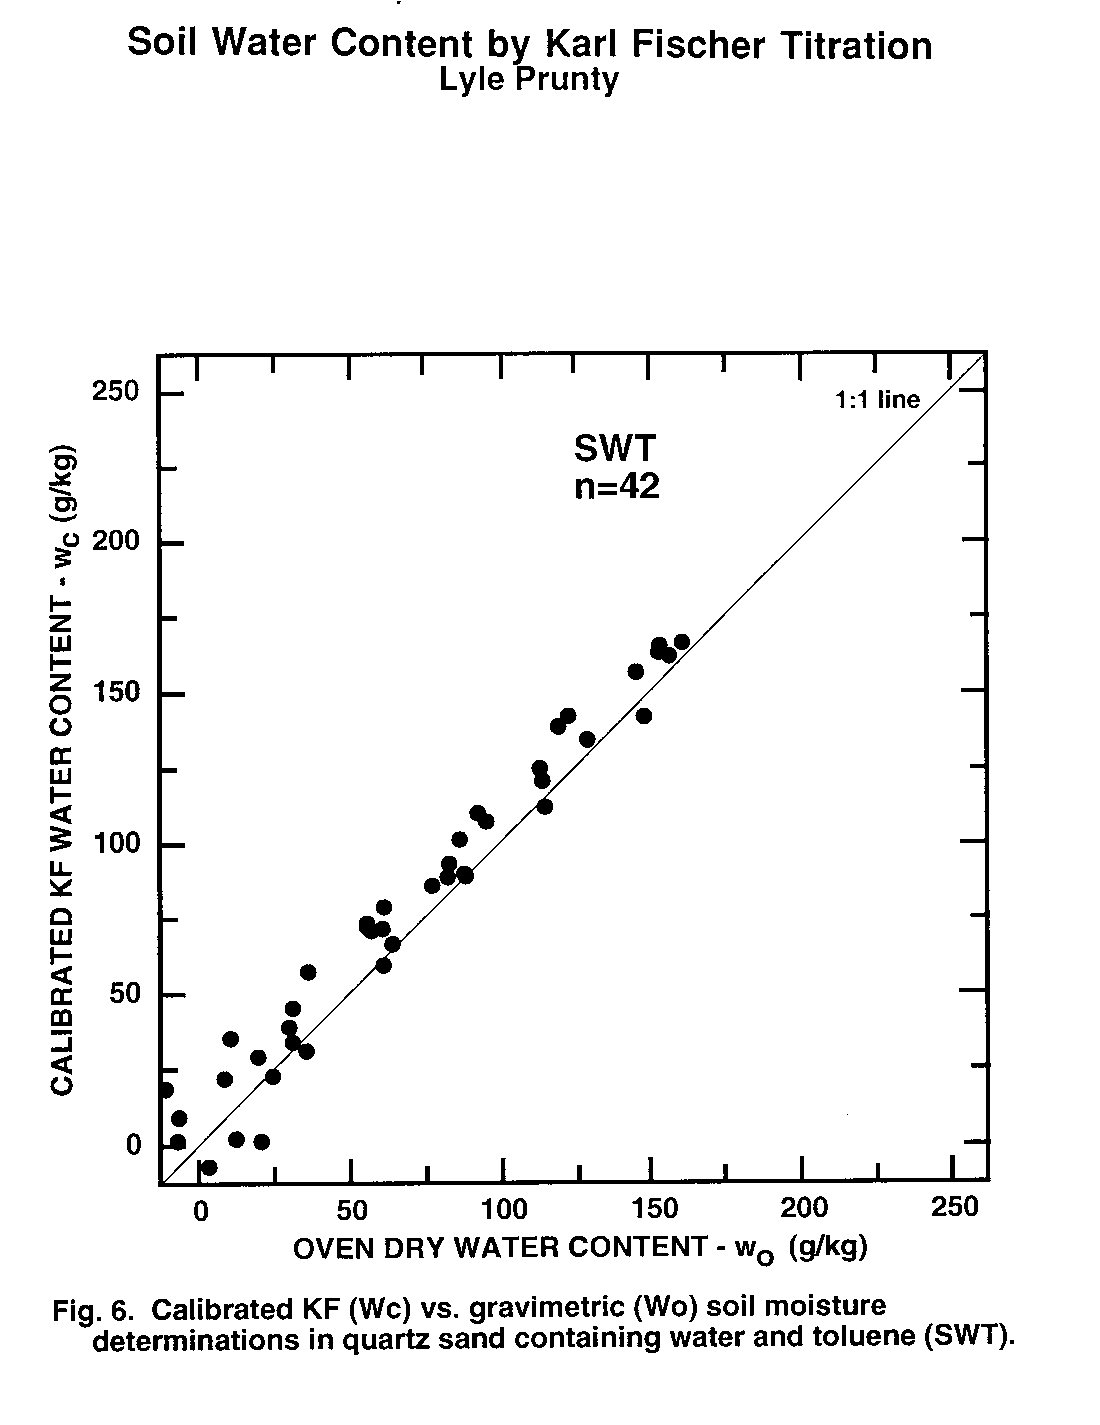
Figure 6. Calibrated KF (Wc) vs. Gravimetric (Wo) soil moisture determinations in quartz sand containing water and toluene (SWT).